As previously written, Nagios support is coming to RHQ.
Well, Alex has done more work and actually it is here now in its first version and is out-of the box able to monitor the standard services that are in a Nagios install:

(Screenshot with standard services and metrics)
This picture shows again the setup:
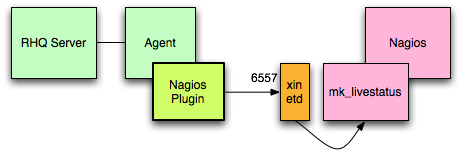
To take the nagios server into inventory, you need to go to a platform and use the Manually Add functionality, where you have to give the connection properties "host, where nagios is on" and "port" (6557 in the image)
But before you can start you have to:
- install mk_livestatus within Nagios and xinetd.
Alex has documented this in the Wiki; the mk_livestatus installation is very well described on the livestatus web page. - For all services in addition to the standard ones supplied in the plugin descriptor you need to update the plugin-descriptor of the plugin. This is described below.
As we know the second step is somewhat cumbersome, we will in the future work to make the detection of the resource types dynamic, so that you basically need to point the plugin at a Nagios install and the plugin will then "learn" all the types of service (e.g. SSH, Swap , ..).
PLEASE give feedback on the plugin on the rhq-devel mailing list.
Be it because you know more cool metrics to look at or because you want to help with the parser issue mentioned below. Also the source has a TODO file, that lists more ideas for contributions :-)
Source
You can get the source from the RHQ git repository in the nagios branch.
This first version has been tagged as RHQ_NAGIOS_PLUGIN_V1
Adding additional services
The following is an excerpt from the plugin descriptor:
   <service name="Root Partition"
         class="NagiosMonitorComponent"
         discovery="NagiosMonitorDiscovery"
         description="root partition service">
      <metric property="free_space|plugin_output|.*/ ([\d]+).*"
           displayName="Free space" measurementType="dynamic"
           units="megabytes" displayType="summary"/>
   </service>
The first thing you need to provide is the name of the RHQ-resourceType, which is used in
<service name="Root Partition"... To obtain those, you can do the following query against mk_livestatus:$ cat service-query
GET services
Columns: display_name
$ nc localhost 6557 < service-query
Root Partition
SSH
...
$
So in this example services were 'Root Partition' and 'SSH'
The next thing is to provide the metrics. The
property="free_space|plugin_output|.*/ ([\d]+).*" attribute is used here. It actually consists of three parts separated by a bar (|) symbol:- Text identifier - currently unused
- The column of the livestatus service query output (see below)
- A regular expression where the first capturing group is used as return value
Let's have a look at an extended service query (actually in version 1.0 of the plugin, only he plugin_output column is supported, as the parser in the plugin needs some more work (see below):
$ cat service-query
GET services
Columns: display_name plugin_output
$ nc localhost 6557 < service-query
Root Partition;DISK OK - free space: / 3611 MB (48% inode=71%)
...
$
So Root Partition delivered "DISK OK - free space: / 3611 MB (48% inode=71%)" which is then matched by
.*/ ([\d]+).* to extract the value of 3611.The parser issue
mk_livestatus delivers as default data separated by semicolon (;), but some columns like 'perf_data' (not shown above) can also return data that consist of multiple items separated by semicolon, so that the parser counts wrong and delivers bad answers.
Luckily mk_livestatus can do some output formatting that can help to work around this. Please ping us if you want to help here.
No comments:
Post a Comment